Bridges (edges) and bridging nodes (vertices) in a network are essential in connecting cliques, moderating the debate and introducing new ideas and innovations and filling structural holes in a network (ref. Ronald S. Burt).
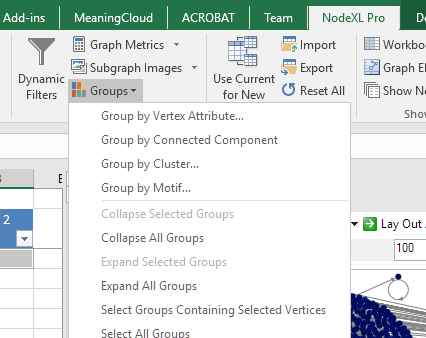
When you separate vertices in groups in NodeXL (figure), several columns are added to your “edges” sheet, mainly “Vertex 1 Group” and “Vertex 2 Group”
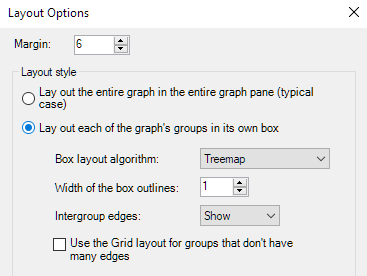
Refreshing the graph using the “lay out each of the graph’s groups in its own box” (figure)
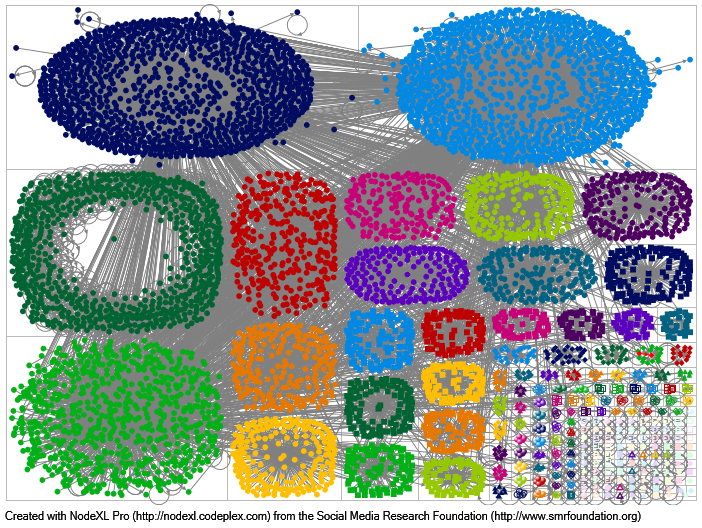
return a graph where nodes/vertices are separated into groups, each painted in a different color:
Finding edges with high centrality or degree is straightforward in NodeXL but, what if you wanted to find the bridges between groups? people who are transporting/propagating the debate/discussion from one clique to the other?
First, we need to determine the bridging edges between groups:
- In the Edges vertices, add a column “Bridging” and type the following formula: =IF([@[Vertex 1 Group]]<>[@[Vertex 2 Group]],1,0). This formula should return 1 if the the group of Vertex 1 is different from the group of Vertex 2 (“vertex 1 group” and “vertex 2 group” columns)
- Hide the edges that do not traverse groups but adding the following formula in the “visibility” column in the “edges” sheet: =IF([@Bridging]=1,”Show”,”Hide”)
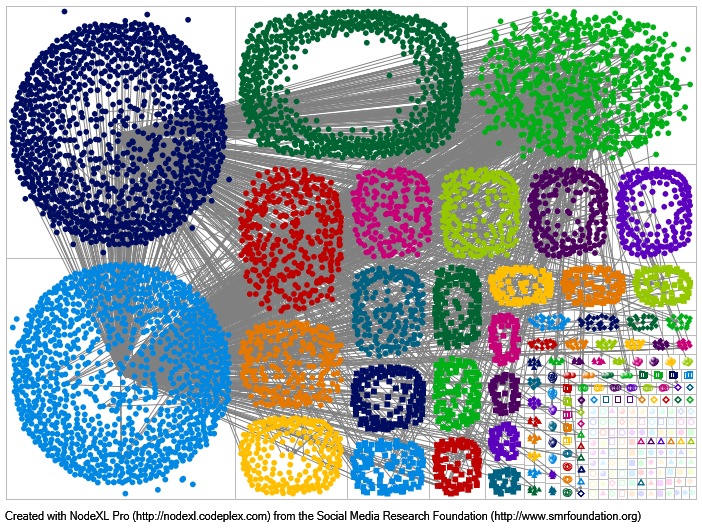
If you refresh the graph now, it should look like this:
It is still confusing but most edges have disappeared. Next step is to hide the vertices that are no longer connected to any other vertex (technically, the vertices that do not bridge with other vertices in other groups or cliques):
In the “Vertices” sheet, add a new column, “bridge”. We need to count/sum all the bridging edges where this vertex is connected (left or right). The formula to add in the “bridge” column is: =SUMIF(Edges[Vertex 1],[@Vertex],Edges[Bridging])+SUMIF(Edges[Vertex 2],[@Vertex],Edges[Bridging])
the formula in simple English: Sum the values in the Bridging column only if the Vertex 1 column in the Edges table contains the name of the current vertex. Do the same if the name of the current vertex is in the vertex 2 column.
A value of zero means that the vertex is not a bridging node. The higher the value, the higher the number of connections of this vertex to people outside its group or circle of friends:
The last step is to hide the non-bridging vertices. In the Visibility column of the vertices sheet, type the following formula: =IF([@Bridge]=0,”Hide”,”Show”)
You can also use “Skip” instead of “Hide” to exclude the non-bridging vertices from future calculations (need recalculation).
To display the names of the vertices, in the “Label” column, type =[@Vertex]
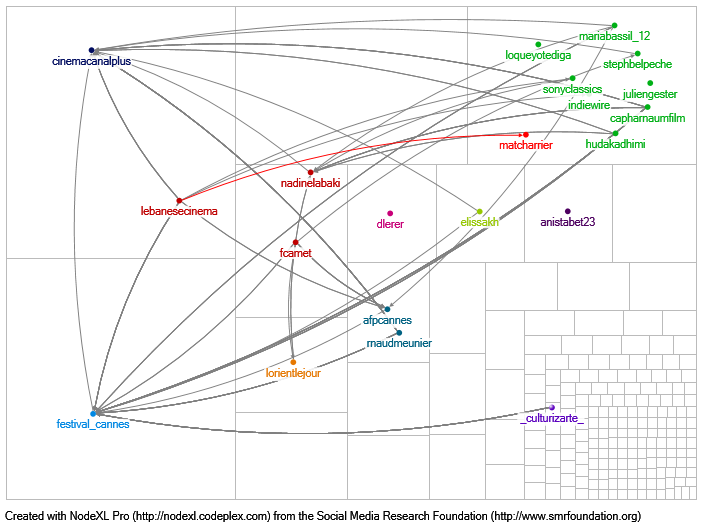
In the image below, for aesthetic purposes, I hid all the bridging nodes that have less than ten connections with other groups (=IF([@Bridge]<10,”Hide”,”Show”) in the Visibility column of the vertices sheet instead of =IF([@Bridge]=0,”Hide”,”Show”):
In a glimpse, we can now see that “canal plus”, “cannes festival”, “nadine labaki”, “sony classics”, etc., have helped disseminate the information to ten groups or more.
The sheet used for this post can be downloaded here.
